

Updated October 22, 2021
While affordable housing has been debated for years, housing insecurity, wealth gaps and eviction trends have become more prominent during the pandemic. As an organization that helps match renters with their new homes, Rent. has closely been following these issues over the past several months.
To provide a better visualization of what’s happening across America, we collected data from the U.S. Census Bureau and created the following interactive dashboards. Using the tools provided below, you can filter and download housing insecurity and eviction or foreclosure risk survey data by a nation, state or metropolitan area view.
Housing insecurity trends
The following dashboard looks at the percentage of adults in owned or rented households across the country who are behind on rent or mortgage payments, and who have little to no confidence in their ability to pay the next month’s rent or mortgage on time.
Please note, this data represents an estimate from the U.S. Census Bureau based on a sample of the entire population (national, state or metro), and the exact number may vary within the margin of error.

Eviction trends
Renters and homeowners who are behind on rent or mortgage payments may be at risk of eviction or foreclosure. Local eviction moratoriums are in place across several parts of the country. However, these measures are not designed to forgive debt; rather, they are just delaying what may be inevitable for millions of households in America.
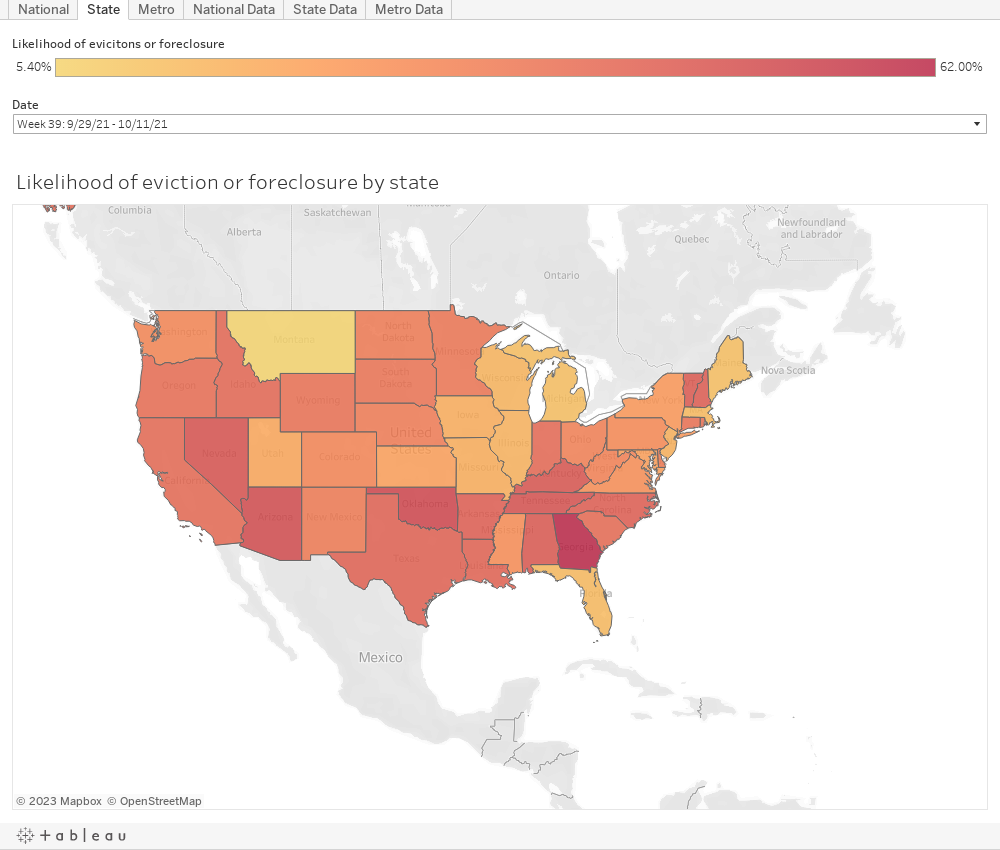
The dashboard below shows the percentage of adults in households behind on rent or mortgage payments and eviction or foreclosure in the next two months is at least somewhat likely. As with the housing insecurity data, this survey represents an estimate based on a sample of the entire population and exact figures may vary within the margin of error.
Using this data
You are welcome and encouraged to use this data and visualizations for your own reporting purposes, we just ask that you attribute the source. Please include proper citation to Rent. and the U.S. Census Bureau, and link to this page.
To download the data:
- Click on the National Data, State Data or Metro Data tab on either visualization
- Click on the download icon in the bottom right corner of the dashboard
- Select the file format for which you would like to receive your data
To embed the visualizations on your website:
- Click on the view for which you want to embed
- Click on the share icon in the bottom right corner of the dashboard
- Copy the embed HTML code
This dashboard will update roughly every two weeks as new data becomes available. Reporting may be delayed around weekends and holidays. Please reach out to press@rentpath.com if you have any questions regarding the use of the data.
Data methodology
The data used in our visualizations comes from the U.S. Census Bureau’s Pulse Survey. The survey evaluates what impact the pandemic is having on households across the country from a socioeconomic view.
The metro areas included in this analysis are the 15 largest MSAs (Metropolitan Statistical Areas) in the country.
According to the U.S. Census Bureau, percentages are based on reporting distributions and do not include the populations that did not report to specific items.
This data contained in these dashboards is distributed for public use by the U.S. Census Bureau. Rent. did not independently collect survey responses. Please refer to the U.S. Census Bureau for any specific questions regarding the methodology.
